Operational evidence
Multiple descriptions of how demand, workload, and staffing capacity interacted were compared rather than treated as isolated anecdotes.
A map-only Frustration Audit engagement showing how a recurring staffing-pressure condition was converted from a vague operational strain into a clear structural mechanism.
Leadership did not need to be told that staffing felt difficult. The value of the engagement was that the audit made visible the mechanism by which that difficulty reproduced itself.
Northbridge engaged The Frustration Audit to examine a recurring operational condition associated with clinician turnover, fluctuating staffing levels, and sustained caseload pressure.
The presenting concern was not merely that staffing felt difficult. It was that vacancies appeared to reduce the organization’s ability to distribute incoming demand evenly, increasing pressure on remaining clinicians and allowing staffing shortages to persist.
This was a map-only diagnostic.
The product was structural clarity, not implementation planning, morale intervention, or personnel evaluation.
Map-only work is a complete deliverable, not a polite appetizer for consulting.
The mapped surface area was intentionally narrow. The audit covered the portion of the organization directly tied to the presenting condition: intake and referral flow, caseload distribution, clinician service delivery, vacancies, recruitment and hiring, and staffing levels.
It did not attempt to explain the entire organization, diagnose personalities, or account for every external force acting on the enterprise.
The Frustration Audit began by assembling operational evidence and converting that evidence into a structural model. The evidence base included a pre-agreement client brief, confidential staff survey responses, a narrative operational dataset derived from those responses, executive clarification on specific mechanics, and structural mapping analysis across sources.
Multiple descriptions of how demand, workload, and staffing capacity interacted were compared rather than treated as isolated anecdotes.
Responses were read for mechanical descriptions of how work moved, where load accumulated, and where dependencies concentrated.
The objective was structural visibility within the relevant execution chain, not a total theory of the organization.
The staffing condition was not best understood as a loose pile of complaints. It was better understood as a recurring structural mechanism.
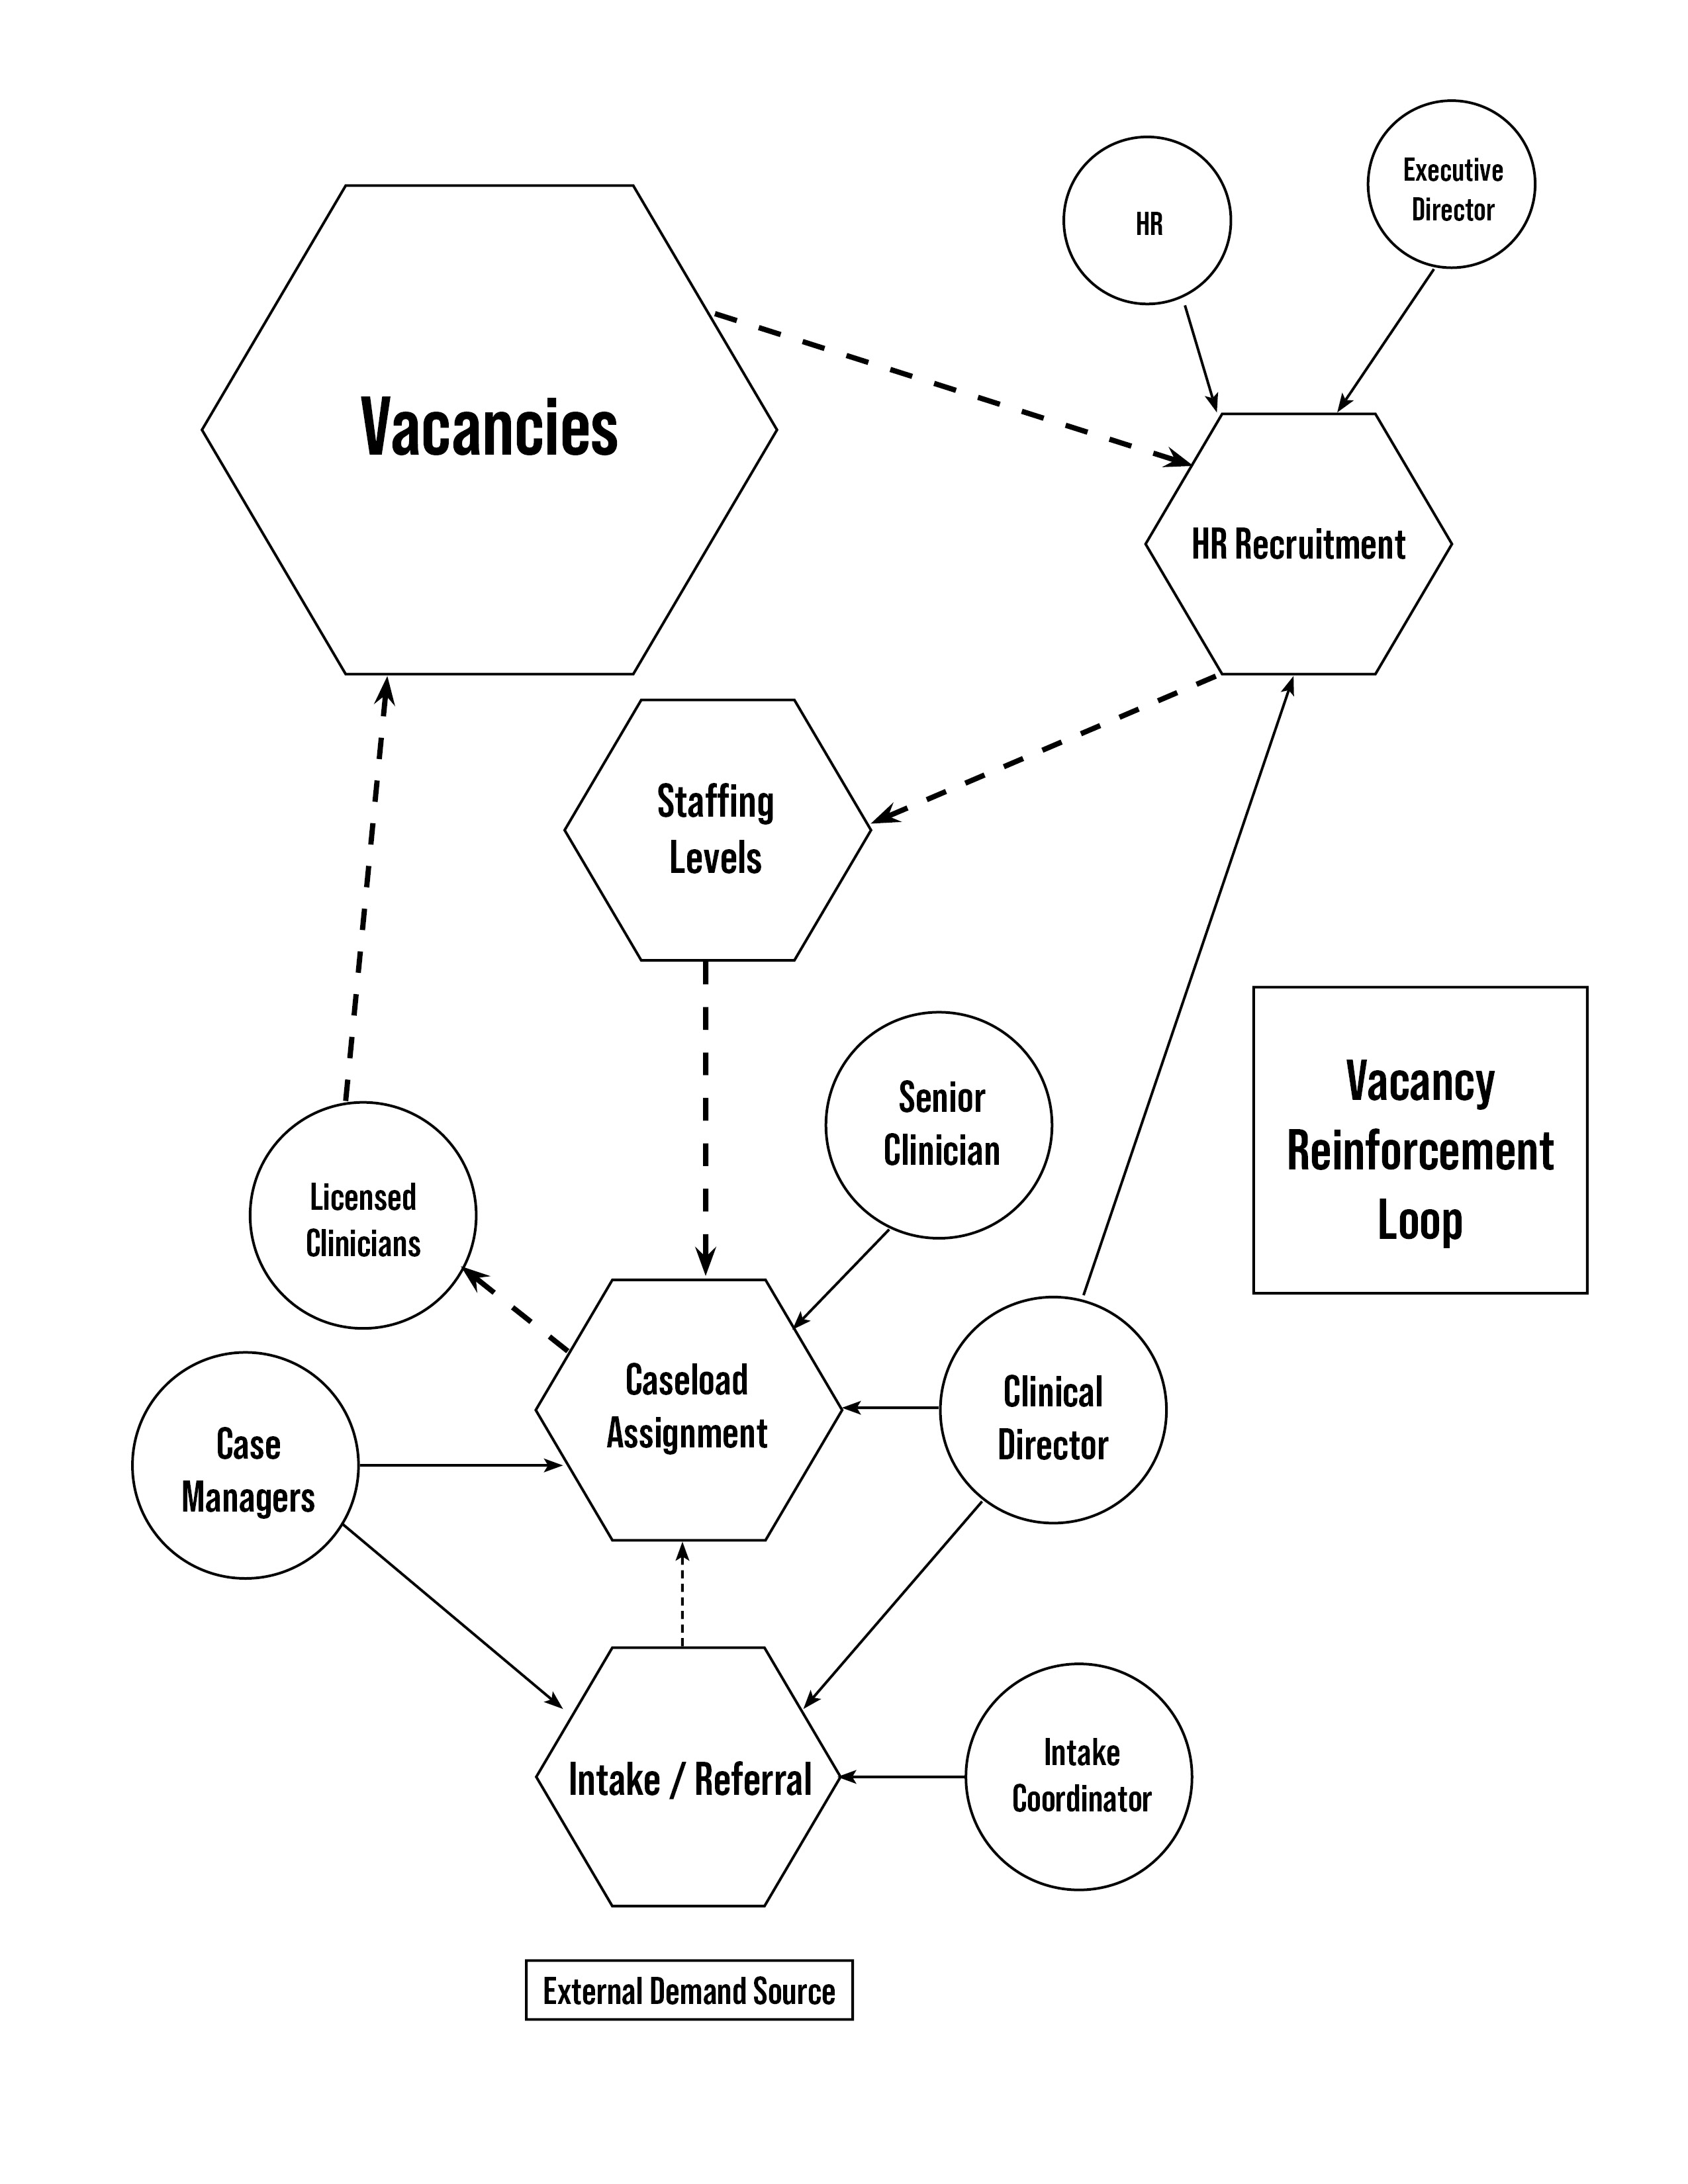
Demand entered through intake and was not meaningfully regulated by staffing capacity. Incoming clients then moved into a caseload assignment process involving clinical leadership and case management. Licensed clinicians represented primary service-delivery capacity, so when clinicians left, vacancies reduced available capacity and existing caseloads had to be redistributed across those who remained.
Recruitment existed as the restoration mechanism, but it operated with delay rather than immediate replacement.
The map also made leadership’s structural location visible, especially at the allocation point. That matters because a correct map must let leadership see where it is positioned inside the loop without collapsing into blame language.
Condition: Northbridge experiences recurring clinician staffing pressure.
Mechanism: External referral demand enters through intake without being regulated by staffing capacity, is translated into clinician workload through caseload assignment, and becomes more concentrated when vacancies reduce staffing levels faster than recruitment can restore them.
Consequence: Remaining clinicians absorb higher caseload pressure, increasing the likelihood that the same staffing instability will reproduce itself.
Plainly: External demand → caseload pressure → clinician turnover → vacancies → reduced staffing levels → increased caseload pressure.
The report names this recurring mechanism the Vacancy Reinforcement Loop. The point is not that every departure has one cause, or that some hidden villain is stirring a cauldron in HR. The point is that the system contains a reinforcing cycle that can continue operating even when everyone involved is acting in good faith.
The value of the engagement was not motivation, reassurance, or a list of generic best practices. The value was that it made the condition visible, bounded, and transferable.
Multiple independent descriptions converged on the same relationship between demand, caseload distribution, staffing levels, vacancies, and recruitment delay.
The audit clarified where pressure actually moved: intake, allocation, clinician capacity, and vacancy periods.
The audit did not pretend to explain every aspect of turnover, morale, labor markets, or organizational culture. It mapped the relevant surface and stopped cleanly.
One reason this case works well as an exemplar is that the report distinguished among direct observation, operational inference, and structural inference. The job was not to pretend omniscience. The job was to present a traceable structural model.
The report also named additional data that could strengthen later precision, including turnover rates by role, average time-to-hire for clinical positions, caseload distribution ranges, referral volume trends, and seasonal intake fluctuation.
Unknown is a valid outcome.
A Frustration Audit becomes stronger when it names where inference ends and where a future tier of work might begin.
Northbridge did not require the audit to tell leadership that staffing felt difficult. The value of the engagement was that it identified the mechanism by which that difficulty reproduced itself.
That is the work: not to decorate frustration, not to soothe it, and not to turn diagnosis into consultancy soup, but to return the client a clear object they can recognize as the system they are actually living inside.
If your organization is dealing with a recurring problem that has resisted smart effort, the next step is a qualification conversation.
Email: hello@thefrustrationaudit.com
Direct: steven@thefrustrationaudit.com
Phone: +1 (818) 585-9945 Milwaukee Wisconsin Central Time US
PDF: View the full report